Importance of Monitoring Indoor CO2 Levels
HVAC (Heating, ventilation, and air conditioning) systems are programmed to turn on when the temperature detected does not match the thermostat. When it turns on, HVAC systems introduce both fresh air and recirculated air. This system is not programmed to detect or fix the air quality.
This is a common issue in environments that have many occupants, as people are the main source of CO2 indoors. Since the occupants’ respiration transforms oxygen into Carbon dioxide, in an occupied building the CO2 levels tend to increase throughout the day.
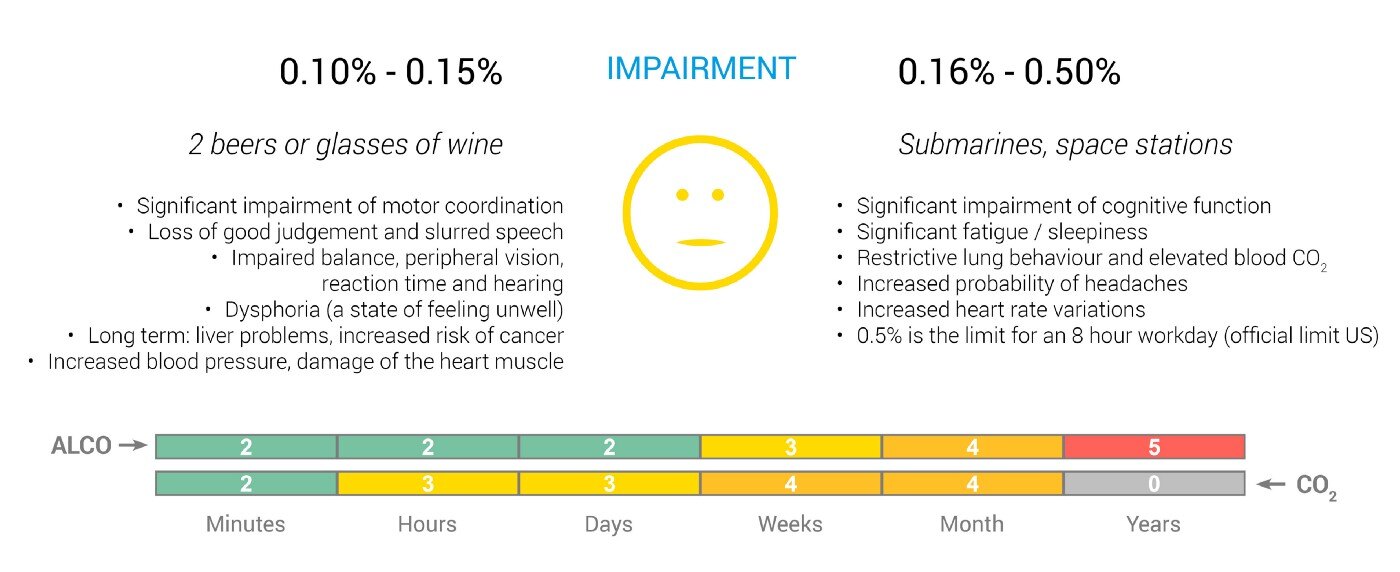
Without a monitoring system, dangerous levels of CO2 are hard to detect due to its lack of odor or color. The human body does not have an internal system to identify it. Humans inhale about 0.04% of CO2, but exhale 3.5% to 5% of CO2.
Throughout history, human bodies never had to develop an internal alert for CO2 concentrations higher than 0.04% as those concentrations rarely occur in nature, and now people are indoors for longer periods of time.
The Intergovernmental Panel on Climate Change even predicts larger increases of CO2 levels in developed cities. Currently the average concentration of CO2 in the atmosphere is about 0.035%. The average concentration of CO2 in the atmosphere is projected to be 0.0695% by the year 2100. This increase of 0.034% will result in a 16% decrease in average brainpower. Major cities such as London could have outside CO2 concentrations above 0.1%, which would raise the indoor levels dramatically.
Measurements
There are three different types of CO2 sensors:
1. Non-dispersive infrared sensors
(Eliminates all light except the wavelength that the selected gas molecules can absorb)
Once air enters the CO2 NDIR sensor, it activates a light set at a specific wavelength for CO2, at one side of the sensor. The other side holds a receptor that measures how much light makes it to the other side. Once the light is activated, any CO2 in the air will absorb some of the beams. In doing so, the amount of light that makes it to the other side of the sensor decreases. The amount of light that gets absorbed depends on how much carbon dioxide is present. The more CO2 that is present, the more light is absorbed.
2. Electrochemical sensors
When CO2 enters the sensor, it chemically reacts within the sensor. As this reaction occurs, the sensor detects a change in the current. Depending on the specific type of sensor, the reaction can make the sensor pick up a current, change an existing current, or change how well the sensor would carry a current. The sensor will then use the type and amount of electrical change to determine how much CO2 is present.
3. Metal oxide semiconductor sensors
MOx carbon dioxide sensors use the measurement of resisting powers of metal compounds to test the amounts of gas in the air. A MOx sensor has a metal strip or film that is exposed to the air that is being tested. This strip has a constant electric current running through it. As the target gas comes into contact with the strip, it will interact with the metal and change the chemical composition either through a reduction or oxidation reaction. When this happens, the resistivity, or conductivity, or the metal will be altered. The kind of resistance change, whether increasing or decreasing, and the magnitude of this change determines the concentration of the target gas.
It’s very important to combine a CO2 sensor with pressure and temperature sensors since carbon dioxide follows the ideal gas law, meaning changes in temperature and pressure could change the concentration of the Co2 and alter the perceived quantity by the sensor.
Most gas sensors give out a signal proportional to the molecular density (molecules/volume of gas), even though the reading is expressed in parts per million (volume/volume).
pV = nRT
p = pressure [Pa]
V = volume of the gas [m3]
n = amount of gas [mol]
R = universal gas constant (= 8.3145 J/mol K)
T = temperature [K]
Forecast of CO2 Concentration Predictions
 This graph represents various projected changes in CO2 based on different scenarios.
A1 – rapid economic growth, global population peaking in 2050. Subset (A1Fl= fossil-fuel intensive, A1T= non-fossil energy A1B =balanced different energy sources)
A2 – world emphasizing self-reliance and preservation of local identities and economic growth, with global population slowly increasing continuously, and slower, more fragmented technological change.
B1 – rapid change to service and information economy, cleaner, more efficient technologies, global population peaking 2050, emphasizing global solutions to sustainability, improved equity.
B2 – local solutions to economic, social, environmental sustainability, intermediate levels of economic development, less rapid technological change, global population continuously increasing.
IS92a – a global energy scenario referred to as a "business-as-usual"(BAU) scenario representing a plausible course for global energy under a public policy that gives no consideration to climate change concerns.
Case Study : Monitoring Experiment
Measurements of Co2 concentration were recorded in two separate offices/companies located in the same building (companies will be referred to as ZL & BN). The workday consisted of 8am to 5pm with two short breaks at 10am and 3pm and a longer lunch break at 12pm.
The physical offices spaces are larger than the average office with open layouts and 15-foot ceilings.
The data in the graphs below follow a Gaussian distribution, which means they are consistent with natural events, which are typically represented by a Gaussian curve.
As we can see from the ZL Office graph the CO2 concentration fluctuates a lot. For example, whenever a window was opened the CO2 concentrations dropped.
CO2 is strongly connected with the fresh air intake and number of people in the room. As can be seen as the days go by, the amount of CO2 builds up and the concentration at the same time, but on different days, follows an increasing trend.
The BN office, which has no windows (thus resulting in more stable concentrations), results are eye-opening since ASHRAE standards (recognized standards for ventilation system design and acceptable indoor air quality) are all respected, but despite that the CO2 concentration is still high. The curve here is more stable, which validates the theory that CO2 concentration is highly susceptible to fresh air flow intake.
Using a CO2 monitor, one can discover the daily pattern of CO2 concentrations (such as the graphs below) and then program to adjust the fresh air intake during the day as needed. For example, at 12pm there is a peak of CO2 concentration each day, shortly before some employees leave for lunch. After which the concentration goes down as more fresh air enters the building.
Zaniboni Lighting Office

BubblyNet